Nvidia stock (NASDAQ: NVDA) rose 2.5% on Wednesday, a modest uptick that has some traders asking a bigger question: has the next major Wall Street positioning already started?
The move comes at a delicate time for the chipmaker, following a turbulent stretch that saw shares drop 14% since the start of the month.
This isn’t just about a single day’s green candle. Investors are parsing whether the bounce marks a technical relief rally or the beginning of renewed institutional buying ahead of catalysts like fresh demand data and product updates.
The significance of even small moves in Nvidia can’t be overstated: the stock remains central to the AI trade, and any shift in sentiment ripples through technology ETFs, peer stocks, and even global indices.
This report breaks down what drove the day’s action, what analysts are saying, and what it means for the broader market.
Nvidia stock: What triggered Wednesday’s move?
No single headline drove the bounce.
Instead, traders point to a combination of factors: the stock had become technically oversold after shedding over $700 billion in market value this month, and the broader market rally, with the S&P 500 posting its strongest three-day run since May, lifted sentiment across tech names.
Trading volume remained elevated, with around 317-320 million shares changing hands on November 25 alone, well above Nvidia’s 30-day average.
Options activity leaned bullish: on the prior session, call options accounted for nearly 62% of total NVDA options volume, suggesting directional conviction among traders betting on a rebound.
Some investors also saw value at current levels. The stock’s forward P/E had dropped to 25 times projected earnings, down from 34 earlier this month.
Adam Sarhan, CEO of 50 Park Investments, noted that Nvidia’s growth remains robust enough that we have no qualms regarding its classification as a growth stock.
Wall Street remains overwhelmingly bullish. Of the 39 analysts covering Nvidia, the consensus rating is “Strong Buy,” with an average price target of $248.26, implying nearly 40% upside from current levels.
Following the company’s recent earnings beat, several major firms raised targets: Citigroup lifted its price target to $270, Barclays moved to $275, and JP Morgan raised its target to $250.
The contrast is stark: bulls see the dip as a buying opportunity, while sceptics warn that Nvidia’s premium valuation depends on maintaining its market share against rising competition from Alphabet and Broadcom.
Today’s move may be small in dollars but big in signal, traders are re-testing whether Nvidia remains the AI market’s barometer.
Options flows suggest institutional players haven’t abandoned ship: the put/call ratio sits at 0.89, indicating a tilt toward bullish positioning.
ETFs with heavy Nvidia exposure, including the SPDR S&P 500 ETF and Invesco QQQ Trust , tracked the stock closely.
The Grayscale Dogecoin Trust ETF, trading under the ticker $GDOG, is now officially live and available in regular brokerage accounts across the United States. The product marks the first spot Dogecoin ETF to reach the market, a milestone many expected would generate intense interest given the global popularity of the original memecoin.
Instead, GDOG’s debut was unexpectedly quiet. The ETF recorded $1.4 million in first day trading volume, which analysts describe as solid for an average ETF launch but surprisingly low for a historic first ever Dogecoin product.
$GDOG (first Doge ETF) saw $1.4m volume on Day One.. solid for an avg launch but low for a 'first-ever spot' product. Not too surprising tho, we actually made a rhyme a while ago predicting this: 'The further away you get from BTC, the less asset there will be.' pic.twitter.com/ermlOcID1J
“Not too surprising tho, we actually made a rhyme a while ago predicting this: ‘The further away you get from BTC, the less asset there will be,” said Eric Balchunas.
Debate Sparks
The lukewarm launch revived a long running question. Should a memecoin be packaged inside a regulated ETF structure at all?
One user asked ETF analyst Nate Geraci if he planned to invest in GDOG. The question continued by arguing that the ETF wrapper may be giving Dogecoin credibility it does not deserve.
Geraci responded by challenging the premise. He asked where investors believe the line should be drawn regarding which assets “deserve” an ETF wrapper. He pointed to the broader context instead. According to Geraci, the launch of GDOG is part of a much larger positive story about rapid regulatory progress in crypto over the past year.
However, he did not answer directly whether he plans to hold the Dogecoin ETF himself.
More ETFs Are Coming
Bloomberg ETF analyst James Seyffart said that Dogecoin and Chainlink are the next two assets lined up for new ETF launches, and the market will see at least five more new crypto ETFs within the next ten days.
Seyffart said he counts more than 130 ETF filings related to crypto assets or crypto derivatives that could hit the United States market in the next six months.
These include futures based products, leveraged funds and a range of additional spot ETFs. Some assets will qualify under the new generic listing standards, which require an active futures market on an approved derivatives venue such as Coinbase Derivatives or CME.
Others, including smaller memecoins like MOG, face hurdles because no futures market exists for them yet. This could delay their ETF prospects until 2026.
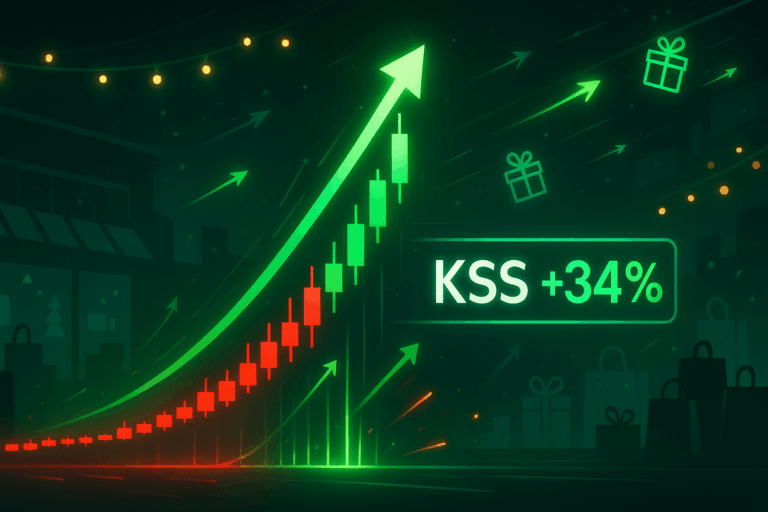
Kohl’s stock exploded 34% on Tuesday, jumping to $21.10 from $15.73 as Q3 earnings delivered an unmistakable turnaround signal.
Same-store sales beat expectations, inventory discipline paid off, and management lifted full-year guidance well above Wall Street’s predictions.
After a punishing 2024 and years of investor skepticism, the market finally saw proof that the restructuring story actually works.
The real question is whether this momentum survives the holiday stretch or collapses back into the “value trap” everyone’s been betting against.
Kohl’s stock: Why Q3 wasn’t just a beat, it was a pivot
Kohl’s delivered results that flipped the script for a retailer everyone had given up on. Adjusted earnings hit $0.10 per share, absolutely crushing the consensus estimate of negative $0.18.
The operational metrics told an even stronger story. Same-store sales dropped just 1.7% compared to the 3.89% decline analysts expected.
That’s the kind of deceleration that signals real traction, not wishful thinking. Inventory management finally showed discipline after years of bloat that dragged on profitability.
The company posted 2% operating margins, consistent with last year’s quarter, but achieved them with tighter stock management.
Here’s what sealed the deal: management raised full-year EPS guidance to $1.25–$1.45 from a previous $0.50–$0.80 range.
That’s not a modest tweak. It’s a 108% increase in the midpoint, signaling that the turnaround momentum is accelerating, not stalling.
The timing couldn’t be better. Holiday shopping is in full swing, and Kohl’s demonstrated it has the product velocity and operational efficiency to capture gifting demand.
The company has doubled gift offerings this season and loaded stores with affordable options under $25, creating real inventory appeal for bargain hunters.
This earned the stock a short squeeze component, with 49% of float short, weak holders panicked out, and momentum traders piled in simultaneously.
The sustainability question: Can holiday season deliver or will Kohl’s revert to form?
The 32% rally assumes a genuine turnaround, but the company is still walking a tightrope.
Comparable sales are declining year-over-year. Traffic remains weak. And the retail sector faces real headwinds from consumer spending concerns in an uncertain macro environment.
December will be the real test. If holiday comps stabilize or turn positive, momentum accelerates, and shorts face a vicious squeeze.
But if December disappoints, the stock collapses back to $16–$18 as the “value trap” narrative returns with a vengeance.
Management is betting it can execute the turnaround playbook faster than anyone expected, but Kohl’s has burned investors before with false dawns.
The fundamentals improved in Q3; that’s real. Whether those fundamentals hold when the holiday season ends, however, is where credibility lives or dies.
Bitcoin is starting the week with a bearish tone as experts watch whether the market will close an important CME futures gap before deciding its next move. The broader trend hasn’t changed much, but the short-term chart is now the center of attention as BTC trades in a tight range and tests crucial support levels.
A CME Gap Is Pulling Bitcoin Lower
This week’s focus is a CME futures gap created between $85,510 and $86,800. Most of that gap has already been filled, but a small portion is still open. Historically, Bitcoin tends to revisit these unfilled zones, and the market appears to be drifting toward that level now.
Spot prices do not have to match futures perfectly, but they often move in the same direction. Because of this, BTC may still dip slightly lower before attempting a recovery.
Short-Term Structure Still Looks Corrective
Bitcoin’s recovery bounce over the weekend stalled quickly. The move up did not show the strength normally seen when bulls are preparing for a breakout. Instead, the chart has formed a series of choppy, overlapping movements — a sign that the market is still correcting rather than trending.
After the small weekend bounce, BTC rolled over again and moved back toward support. The current decline does not look aggressive or panic-driven, which supports the idea of a slow corrective pullback before a stronger rebound attempt.
Support Zone to Watch Today
Bitcoin is now trading inside an important short-term support range between: $85,190 and $82,180
This area comes from earlier consolidation and previous Fibonacci support. As long as BTC stays above this zone, the broader bullish outlook remains in play. A dip into the lower half of this range would also help close the CME gap completely.
If buyers lose this zone, the market could revisit Friday’s low — something that often happens when BTC is in this kind of choppy corrective behavior.
What Signals a Reversal?
The first clear sign that BTC is ready to turn higher would be a break above the recent swing high near $87,820. If Bitcoin climbs above that level, it would show that buyers are stepping in and absorbing selling pressure.
Until then, the price is still vulnerable to another small push lower.
Bigger Picture Still Looks Healthy
Zooming out, nothing major has changed in Bitcoin’s overall trend. Friday’s low may have marked a short-term bottom, and the market now seems to be forming a larger recovery structure that could last for several weeks.
Bitcoin is still pulling back from its recent high, but the decline remains controlled and orderly. As long as the support range below $85k holds, BTC is likely preparing for a broader rebound phase that targets higher resistance levels later this month.
Bitcoin and ether slumped to multi-month lows on Friday, with cryptocurrencies swept up in a broader flight from riskier assets as investors worried about lofty tech valuations and bets on near-term U.S. interest rate cuts faded.
Bitcoin, the world’s largest cryptocurrency, fell 5.5% to a seven-month low of $81,668. Ether slid more than 6% to $2,661.37, its lowest in four months.
Both tokens are down roughly 12% so far this week.
Cryptocurrencies are often viewed as a barometer of risk appetite and their slide highlights how fragile the mood in markets has turned in recent days, with high-flying artificial intelligence stocks tumbling and volatility spiking VIX.
“If it’s telling a story about risk sentiment as a whole, then things could start to get really, really ugly, and that’s the concern now,” Tony Sycamore, a market analyst at IG, said of the fall in bitcoin.
About $1.2 trillion has been wiped off the market value of all cryptocurrencies in the past six weeks, according to market tracker CoinGecko.
Bitcoin’s slide follows a stellar run this year that propelled it to a record high above $120,000 in October, buoyed by favourable regulatory changes towards crypto assets globally.
But analysts say the market remains scarred by a record single-day slump last month that saw more than $19 billion of positions liquidated.
“The market feels a little bit dislocated, a bit fractured, a bit broken, really, since we had that selloff,” said Sycamore.
Bitcoin has since erased all its year-to-date gains and is now down 12% for the year, while ether has lost close to 19%.
Citi analyst Alex Saunders said $80,000 would be an important level as it is around the average level of bitcoin holdings in ETFs.
The selloff has also hurt share prices of crypto stockpilers, following a boom in public digital asset treasury companies this year as corporates took advantage of rising prices to buy and hold cryptocurrencies on their balance sheets.
Shares of Strategy, once the poster child for corporate bitcoin accumulation, have fallen 11% this week and were down nearly 4% in premarket trade, languishing at one-year lows.
JP Morgan said in a note this week that the company could be excluded from some MSCI equity indexes, which could spark forced selling by funds that track them.
Its Japanese peer Metaplanet has tumbled about 80% from a June peak.
Crypto exchange Coinbase was down 1.9% in premarket trade and is on course for its longest losing streak in more than a month.
Crypto miners MARA Holdings and CleanSpark were down 2.4% and 3.6%, respectively, while the Winklevoss twins’ newly-listed Gemini has plunged 62% from its listing price.
“Bitcoin market conditions are the most bearish they have been since the current bull cycle started in January 2023,” said digital asset research firm CryptoQuant in its weekly crypto report on Wednesday.
“We are highly likely to have seen most of this cycle’s demand wave pass.”
Oklo stock price has nosedived in the past few weeks, erasing over $12 billion in value as the market cap dropped from $25.7 billion in October to $13.7 billion. It has plunged from a high of $193 in October to $88 today.
Oklo stock dropped as investors sold shares
One reason why the Oklo share price has plunged in the past few months is that some of its shareholders have dumped it. Data compiled by Barchart shows that insiders have dumped 803,323 shares in the past three months.
At the current price, they have sold shares worth over $70 million. Also, they have dumped over 2.1 million shares in the last 12 months. These shares are currently worth over $184 million.
Some of the insiders selling the Oklo stock are Jacob Dewitte, the CEO, Caroline Cochran, the CEO, William Caroll Murphy Goodwin, the CLO, and Michael Stuart Klein.
Insider sales is usually a risky sign because it sends a message that they are not outright bullish on the company. These concerns normally escalate when these shareholders are not buying the stock.
However, insider sales are not always a bad thing as some of the sellers maintain their large positions. Others sell to fund major purchases. For example, Miriam Adelson sold over $2 billion worth of shares in Las Vegas Sands to fund her Mavericks purchase.
Increasing short interest
Oklo stock price has also crashed as investors increase their short positions on the company. Data compiled by Koyfin shows that the short interest stands at 9.20%, up sharply from 0.03% in June this year.
Increasing short interest is a sign that many investors are placing bids against the company, which they expect to deteriorate over time.
One reason for this bearishness is that the company is yet to receive authorization by American regulators.
Also, investors have shorted the company after it surged hard in the past few months. At its peak, the stock was up by over 3,343% from its lowest level in 2024. It is common for a stock to pullback after going through a major surge. A good example of this is Rolls-Royce, whose stock has pulled back after a multi-year surge.
The stock also plunged after the company published a wider-than-expected loss in the third quarter. Its loss from operations came in at $36.3 million, while its loss before income tax stood at over $29.2 million. Analysts were expecting a smaller loss than that.
Meanwhile, the number of outstanding shares has been in a strong uptrend, diluting existing investors. There are now 156 million outstanding shares, up from last year’s low of 32.3 million.
Most importantly, it is often common for companies in the pre-revenue phase to go through this volatility. A good example of this is NuScale, whose stock has dived by over 66% from the year-to-date high.
Technical analysis also explains why the Oklo share price has remained under pressure in the past few months, falling from the year-to-date high of $194 in October to the current $90.
The stock dropped after forming a head-and-shoulders pattern, a common bearish reversal pattern in technical analysis.
It has now moved below the 50-day Exponential Moving Average (EMA) and the Major S/R pivot point of the Murrey Math Lines tool.
Also, the Relative Strength Index (RSI) and the Percentage Price Oscillator (PPO) have continued falling in the past few months. The RSI is nearing the oversold level of 30, while the PPO has moved below the zero line.
Therefore, the most likely scenario is where the Oklo share price continues falling as sellers target the next key support at $50.
In the long-term, however, the stock will likely bounce back as investors buy the dip and the authorization by American regulators happens.
XRP is bouncing back today after a volatile week, rising more than 8% in the past 24 hours and trading around $2.03. The broader crypto market is also stabilizing, but XRP’s move is stronger than most major altcoins. This recovery comes just as a major catalyst approaches: another XRP ETF launch.
Why XRP’s Price Is Rising Today
The biggest driver behind today’s bounce is renewed optimism around XRP ETFs. Grayscale’s XRP ETF is set to launch on November 24, following an approval for NYSE listing. This mirrors the pattern seen earlier in 2024 when Bitcoin rallied ahead of its own ETF debut.
Last week, Bitwise also launched its XRP ETF, adding to the growing institutional interest in the asset. These back-to-back ETF approvals are boosting sentiment and giving XRP strong support during a broadly bearish market.
ETF Momentum Is Stronger Than Expected
Despite the underlying price weakness over the past month, XRP ETFs have been outperforming. Canary’s XRPC ETF became the biggest ETF launch of the year across all categories, not just crypto. It has already attracted more than $270 million, which is exceptional for a relatively small issuer like Canary, and it even surpassed major Wall Street firms in day-one volume.
Short-Term: XRP Needs to Reclaim $2.05
XRP’s rally today hit resistance at $2.05–$2.06, a key zone it needs to reclaim to confirm strength. Technically, momentum is improving, but the overall trend remains cautious. Weekend moves are often unreliable, and volume is still lower than expected.
If XRP fails to break above $2.05 with strong confirmation, traders warn that the price could dip to $1.92–$1.85 before finding support again. The market is still dealing with imbalances and gaps left behind after last week’s volatility.
JPMorgan’s senior analyst Kian Abouhossein has outlined his preferred European bank stocks as investors look ahead to 2026.
Despite macroeconomic uncertainty and uneven M&A activity across the sector, Abouhossein believes select names offer compelling value and strong returns.
In a recent CNBC interview, Abouhossein said Barclays, UBS, and NatWest stand out on his list, supported by attractive valuations, disciplined cost measures, and robust profitability.
While Swedish banks, for the most part, appear less appealing due to high premiums and limited growth, these three institutions are seen as well‑positioned to deliver shareholder value in the years ahead.
Barclays Plc (LON: BARC)
Barclays’ stock is one of JPMorgan’s top picks, with Abouhossein highlighting its cheap valuation relative to peers.
“BARC is trading at about seven times earnings, one of the cheapest stocks,” he noted, contrasting it with Goldman Sachs at 15 times.
While the UK macro backdrop remains controversial, Abouhossein believes the discount applied to these British investment banks is excessive.
He argues that Barclays has improved operating leverage and cleaned up its operations since the global financial crisis, making its current valuation too low to ignore.
For investors, BARC shares offer a rare combination of resilience and upside, positioning them as a standout value play heading into 2026. Note that the bank stock currently pays a 2.16% dividend yield as well.
UBS Group (SWX: UBSG)
UBS shares also earn a spot on JPM’s preferred list – thanks to its cost discipline and investment banking strength.
Abouhossein pointed out that “we still like some of the IB plays and they have some good cost measures, such as UBS.”
The Swiss bank has kept cost growth contained at 2-3%, far below the 5-10% increases seen among US peers. This discipline allows UBS to maintain profitability while investing selectively in digital initiatives.
Its global investment banking franchise remains competitive, and the firm’s balance sheet strength adds further appeal.
For investors, UBS stock represents a well‑managed institution capable of delivering consistent returns in a challenging macro environment. It also currently pays a 2.47% dividend yield.
NatWest Group (NYSE: NWG)
NatWest stock rounds out JPM’s top picks, with Abouhossein praising its strong retail banking model in the UK.
“NatWest, a pure retail bank in the UK making 18% returns, a very healthy environment,” he said.
The bank’s focus on retail operations has allowed it to generate impressive profitability, supported by disciplined cost control and a favourable domestic market.
Despite broader concerns about the UK economy, NWG’s ability to deliver double‑digit returns on equity makes it a compelling choice for investors seeking stability and income.
With its strong capital position and consistent performance, NatWest is viewed as a reliable stock to own heading into 2026 – especially since it pays a rather lucrative dividend yield of 4.26%.
Hedera Price prediction highlights HBAR could reach $0.750 by the end of 2025 if bullish trends continue.
The Long-term forecasts suggest HBAR could hit $2.20 by 2030, indicating stable growth potential.
Hedera has been making waves in the cryptocurrency space, with a fast and secure blockchain that offers a distinct approach to transaction processing compared to Ethereum and other smart contract chains. It’s permission-only, meaning the blockchain is managed by private companies. Limiting what types of decentralised applications are allowed is what makes Hedera stand out from the rest.
Having entered the top 20 digital assets by market cap in 2024, it is now eyeing a potential leap into the top 10 by the end of 2025. Hedera has also recently ramped up its development activities for its ecosystem. Its ecosystem is strengthening, despite its capped price action. With increasing real-world use cases, institutional interest, and strategic partnerships, many are closely tracking HBAR price chart 2025 to gauge how high the token can rise.
With major companies like Google, IBM, and Chainlink Labs backing the project, and discussions about SEC approved HBAR ETF would flood string liquidity. Many are intrigued that: Will the HBAR Price Reach $1? Let’s discuss this in our Hedera price prediction 2025 article.
Hedera Price Analysis 2025: A Look Back at HBAR’s Volatile First Half
Hedera price USD began the year on a high note, peaking at $0.40 in mid-January before a steady decline took it to a low of $0.125 in early April. This downturn was caused by external factors and waning investor interest, reflected in a decrease in the Total Value Locked (TVL).
But this tide turned in the second week of April. As a broader crypto market rally helped HBAR price break free from the wedge, it bounced off a significant support zone that had previously fueled a late 2024 rally. This support, confirmed by the Fixed Range Volume Profile (FRVP) indicator, suggested strong institutional buying interest. The momentum propelled HBAR on a remarkable surge of nearly 80%, from $0.125 to $0.228 by mid-May
Unfortunately, this rebound was cut short by escalating geopolitical tensions, which pushed HBAR back to its April lows by the end of June. During this time, the price formed another parallel declining wedge.
Hedera Price Prediction 2025
The second half of the year started strong, with HBAR posting a significant rally in July from the $0.12 to $0.14 demand zone up to $0.30.
However, this upward move was firmly rejected at a critical resistance point, which strongly aligned with the upper boundary of a descending triangle established since early 2025.
This rejection fueled a sharp decline throughout August and September, which worsened further with a critical liquidation event on October 10th, momentarily pushing the price below the demand zone to $0.10.
This dip was quickly absorbed by institutional buyers, leading to a recovery attempt that failed to flip $0.20 psychological resistance, but after a decent consolidation below this hurdle buyers accumulated it and on October 28th it saw an near 20% rise that pushed its price to $0.22, this occurred as the much-anticipated launch of the Canary HBAR ETF (HBR) on Nasdaq opened the doors for institutional investors.
However, the bears capped momentum again due to uncertainty about the Fed’s future rate cut, generating risk-off sentiment in the HBAR price, and the intensification of the war between Russia and Ukraine, creating even more discomfort for investors. This pushed HBAR/USD to the $0.12-$0.13 support region, which had shown good demand in previous instances, such as November 2024. A significant rally was generated from this level, followed by another reaction in April, and then in June, and now in November, it is retesting the same zone.
Now, reversal odds are high, and a huge rally could break out towards retesting $0.40 in future sessions. However, if this demand area has weakened and allows the HBAR price to deteriorate further, then HBAR might risk falling to the initial lower range around $0.045-$0.073 by the end of December.
HBAR Price Prediction November 2025: What’s Next for Hedera?
The HBAR price in November continued to decline after being rejected from the upper border of the descending triangle, and it is currently at a key support area around $0.12-$0.13, where the odds of a reversal are high.
If it rises, then $0.19 is key to determining the bullish strength, true or fake. However, if it climbs stronger and even surpasses $0.25, then the rally has taken place and can be considered genuine.
However, if the key zone breaks, then December could see a decline extending.
Month
Potential Low
Potential Average
Potential High
HBAR Price Prediction November 2025
$0.125
$0.27
$0.40
HBAR Price Prediction 2026 – 2030
Year
Potential Low
Potential Average
Potential High
2026
$0.45
$0.80
$1.05
2027
$0.60
$0.95
$1.20
2028
$0.65
$1.10
$1.40
2029
$0.70
$1.35
$1.60
2030
$0.95
$1.70
$2.20
HBAR Price Prediction 2026
Moving forward to 2026, forecast prices and technical analysis project that Hedera’s price is expected to reach a minimum of $0.45. The price could escalate to $1.05 on the higher end, with an average trading price hovering around $0.80.
HBAR Price Forecast 2027
Looking ahead to 2027, the optimism around Hedera will lead to steady growth. Hence, the HBAR price is forecasted to reach a low of $0.60, with a potential high touching $1.20 and an average forecast price of $0.95.
Hedera Price Forecast 2028
As we advance to 2028, with moderate gains, the HBAR predictions indicate that the price of a single HBAR could reach a minimum of $0.65, with the ceiling potentially rising to $1.40. Within the range, the average price will be $1.10.
HBAR Price Target 2029
By the time 2029 rolls around, it’s predicted that Hedera’s price will maintain its upward trajectory, reaching a minimum of $0.70, with the maximum price possibly reaching $1.60 and an average of $1.35, reflecting cautious optimism.
Hedera Price Prediction 2030
By the end of this decade, HBAR is predicted to touch its lowest price at $0.95, aiming for a high of $1.70 and an average price of $2.20. Hence, the prediction suggests stable long-term growth for Hedera’s market value.
Market Analysis
Firm
2025
2026
2030
Changelly
$0.259
$0.370
$1.74
priceprediction.net
$0.27
$0.40
$1.99
DigitalCoinPrice
$0.43
$0.50
$1.07
Coinpedia’s Hedera Price Prediction
By the end of 2025, the recovery run in HBAR prices is expected to continue with a gradual rise in momentum. Hence, by the end of 2025, Coinpedia’s HBAR price forecast expects a potential high of $0.80 with a solid support at $0.40, making an average of $0.60.
Year
Potential Low
Potential Average
Potential High
2025
$0.40
$0.60
$0.80
Never Miss a Beat in the Crypto World!
Stay ahead with breaking news, expert analysis, and real-time updates on the latest trends in Bitcoin, altcoins, DeFi, NFTs, and more.
FAQs
Is HBAR investment a profitable one?
Yes, the stout fundamentals of the network make HBAR a good investment, but for the long term.
What price can HBAR reach by the end of 2025?
Analysts forecast HBAR could peak at $0.75 by the end of 2025, with averages near $0.40 and lows at $0.15.
How many transactions can Hedera process in one second?
The network can process over 10,000 transactions in one second.
How high will the HBAR price climb by the end of 2030?
By 2030, HBAR is forecast to reach highs of $2.20, averaging around $1.70 with lows near $0.95.
Where can I trade HBAR?
HBAR is available for trade across leading cryptocurrency exchange platforms such as Binance, Coinbase, Zebpay, etc…
The company raised its full-year earnings and sales outlook Thursday, heading into the crucial holiday shopping season.
Walmart also offered fresh signs that it is shedding its original identity as a strictly down-market brick-and-mortar operation by growing its e-commerce business and increasing its market share of higher-income shoppers.
Walmart’s shares closed more than 6% higher Thursday, even as the broader market suffered a dramatic sell-off. The stock is up more than 18% this year.
The biggest retailer and grocer in the United States acknowledged the added financial pressures on lower-income households but said middle-income families are holding up. Walmart saw more sales growth in its grocery and health and wellness product categories than in general merchandise.
‘As pocketbooks have been stretched, you’re seeing more consumer dollars go to necessities versus discretionary items,’ Chief Financial Officer John David Rainey said on a call with analysts Thursday morning.
The company reported that same-store sales for Walmart U.S. rose 4.5% in the quarter that ended Oct. 31, exceeding analysts’ expectations.
“The team delivered another strong quarter across the business. eCommerce was a bright spot again this quarter. We’re gaining market share, improving delivery speed, and managing inventory well,” outgoing CEO Doug McMillon said in a statement.
Walmart reported 27% growth in e-commerce sales globally.
Walmart also announced that it will move from trading on the New York Stock Exchange to the tech-heavy Nasdaq next month. It’s the latest sign of America’s largest private employer working to position itself as tech-forward in order to compete with Amazon.
The discounter’s third-quarter earnings come amid growing questions about whether Americans contending with tariffs, corporate layoffs and accelerating inflation are still confidently spending on retail.
As a bellwether for the U.S. economy and consumer confidence, Walmart’s strong earnings and guidance indicate that consumers are still shopping — at least at the lower end of the retail price point.
The company announced last week that McMillon will step down in January. McMillon, 59, started at Walmart as an associate in the 1980s and has helmed the company since 2014.
Under his leadership, Walmart improved pay and benefits for many employees, renovated hundreds of stores and boosted its e-commerce and delivery programs, especially during the Covid pandemic.
John Furner, CEO of Walmart U.S., will take over the top job Feb. 1. Since 2019, Furner has led Walmart’s American operations — by far the largest slice of the company, with around 1.6 million of Walmart’s approximately 2.1 million total associates worldwide.
Walmart is leading the retail race against longtime rival Target,which Wednesday reported a drop in third-quarter sales and cut its full-year profit guidance.
Target’s sales have faltered over the last few years, with some consumers expressing frustration over what they said were disorganized stores and rollbacks of the company’s diversity, equity and inclusion initiatives.
In October, Target said it would cut about 1,800 corporate jobs.
Target is hoping for a fresh start in the new year. Incoming CEO Michael Fiddelke will take over Feb. 1, the same day Furner becomes CEO of Walmart.
The struggling retailer said Wednesday that it plans to increase its investment in stores and technology next year by 25%.
Since January, U.S. businesses have had to contend with ever-changing tariffs under the Trump administration. Walmart has navigated the uncertainty by raising prices on some items, while swallowing some tariff costs on others. In the three months that ended Oct. 31, prices at Walmart U.S. rose around 1% overall, with higher prices on electronics, toys and seasonal items in particular due to tariff pressures.
In the grocery section, Walmart expects egg prices to drop but anticipates the record-breaking beef prices will stay high, in part from cattle herds shrinking over the last few decades.
Prices for other grocery staples are also up, though the Trump administration’s rollback of tariffs on many food items last week could offer some relief.
Despite the rising prices, Walmart is offering its annual Thanksgiving menu deal for 10 at less than $4 per person. It’s less expensive than last year’s package, but it also contains fewer items.
The company is also expanding its use of artificial intelligence, teaming up with OpenAI to allow customers to buy from Walmart within ChatGPT. Walmart has not detailed the terms of the partnership or shared when the new option could be available.
This week, Target announced its own collaboration with OpenAI.
Walmart has lagged behind rival Amazon in AI-driven e-commerce — Amazon debuted its Rufus shopping assistant in February 2024, more than a year before Walmart launched its counterpart, Sparky.