
Archive

April 2026

Browsing

Tesla shares attempted a rebound on Monday but failed to sustain momentum after last week’s disappointing delivery report.

The stock was down around 2% at $353.41 in early trading.

The broader market showed modest strength, with the Nasdaq up 0.3%, while the Dow Jones Industrial Average was flat.

Tesla shares had already declined 5.4% on Thursday ahead of the holiday weekend, following the release of first-quarter delivery figures that fell short of expectations.

Delivery miss and inventory build

Tesla reported deliveries of 358,023 vehicles in the first quarter, below Wall Street expectations of about 366,000 units.

The company also produced roughly 50,000 more vehicles than it delivered.

The resulting inventory build has raised concerns about future pricing pressure and potential production adjustments.

JPMorgan analyst Ryan Brinkman highlighted the issue in a note, stating that the “record surge in unsold vehicles adds to free cash flow woes.”

He noted that inventory ties up cash until it is sold.

Tesla has historically generated free cash flow, but that trend may not continue in the near term.

The company is expected to see negative free cash flow this year as capital expenditure rises sharply.

Spending is projected to reach about $20 billion, up from $8.5 billion last year.

Much of this investment is directed toward artificial intelligence initiatives, including robotics and other emerging technologies.

JPMorgan flags downside risks

JPMorgan reiterated its underweight rating on Tesla and maintained a $145 price target, implying significant downside from recent levels.

“We … advise investors approach TSLA shares with a high degree of caution,” Brinkman said.

“Although both technology and execution risk seem substantially less than was once feared, expansion into higher volume segments with lower price points seems fraught with greater risk relative to demand, execution, and competition.”

The firm lowered its 2026 earnings per share estimate to $1.80 from $2, below consensus forecasts, after the delivery miss.

Brinkman added that while Tesla has a differentiated business model, strong product portfolio and leading technology, these positives are “more than offset by above-average execution risk, rising competition, growing controversy with regard to the brand, and valuation that seems to be pricing in a lot.”

Prolonged weakness in Tesla stock

Thursday’s decline marked Tesla’s seventh consecutive week of losses, with the stock falling about 14% over that period.

The downward trend began after the company reported better-than-expected fourth-quarter earnings in January.

Despite the strong results, the stock failed to gain traction, as investors looked for new catalysts.

Market participants are increasingly focused on Tesla’s AI-related opportunities, including autonomous vehicles and robotics, rather than near-term delivery performance.

Mixed analyst views persist

Not all analysts are equally cautious. Baird lowered its price target slightly to $538 from $548 while maintaining an Outperform rating.

The firm said weaker energy deployment figures could weigh on the stock in the near term.

It also noted that investor discussions have shifted away from core automotive metrics toward energy and broader strategic initiatives.

The divergence in views reflects the current positioning of Tesla.

While long-term expectations remain tied to AI and new business lines, near-term pressures from deliveries, inventory, and cash flow continue to weigh on sentiment.

The post Tesla stock sinks 2% on Monday as analyst suggests caution appeared first on Invezz

The post Solana Price Under Pressure as Selling Activity Rises—Is More Downside Ahead? appeared first on Coinpedia Fintech News

Solana price is down by 1.5%, reaching $78.82, plunging below $80, and underperforming the broader market, primarily driven by continued fallout from a major ecosystem hack. The $285 million exploit on Solana-based Drift Protocol on April 01, 2026, remains a dominant overhang. The hack by the North-Korean hackers dropped Drift’s TVL from $530 million to $230 million, creating a liquidity crisis and community distrust. This has also pressured the SOL price as investors reassess ecosystem security risks. 

As a result, the SOL price is showing a structural weakness in times when the broader market attempts to stabilise. Hence, the increase in the sell-side pressure is shaping a cautious outlook for the short term.

Price Structure Shows Weakness Near Key Support

Solana is trading at a critical support zone near $75–$78, with the current price hovering around $78–$80, showing clear signs of weakness after failing to sustain its recovery above $85. While the broader market is attempting to stabilise, SOL continues to lag, indicating a lack of strong buyer conviction at higher levels. This is not a trend continuation — it’s a pressure phase at support, where holding or losing this range will define the next move.

On the daily chart, SOL has broken down from an ascending channel and is now consolidating just above the $77 support, which aligns with key short-term levels. Repeated retests of this zone without a strong bounce suggest weakening demand. RSI is below neutral, reflecting fading momentum, while the structure shows lower highs forming after rejection near $90–$95 resistance. 

If this support fails, the next downside targets open toward $73, followed by a deeper move toward $67–$70. On the upside, SOL needs to reclaim $85–$86 to regain short-term strength, with $93–$95 acting as the next key resistance zone.

TVL Decline Signals Capital Outflow

TVL reflects actual capital deployed within the ecosystem. A decline of this scale indicates reduced DeFi activity, lower user participation and Capital rotating out of the network. The DeFiLlama data shows a consistent drop in Solana’s TVL, falling from above $9 billion to nearly $5.5–$6 billion in recent weeks.

This indicates the funds withdrawn may be converted to stablecoins or other assets and rotated into other ecosystems. As TVL is a confidence metric, new capital hesitates when it drops, and existing holders reduce exposure. Therefore, the current decline, combined with the price sitting near support, indicates weak demand while the supply is rising. 

What’s Next—Will SOL Price Secure Range Above $85 This Week?

The Solana price is not just reacting to price pressure; it is reflecting a broader slowdown in capital participation. The drop in TVL indicates that liquidity and user activity within the ecosystem are declining, which reduces the strength of any potential recovery.

At the same time, the price is holding near a key support zone around $75–$78, but without strong follow-through. This combination — weak structure on the chart and declining TVL — suggests that the current phase is more of a fragile hold than a strong base.

In practical terms, this limits upside in the near term. Even if SOL attempts a bounce, the absence of capital inflow makes it difficult to sustain higher levels. For a meaningful move higher, the price needs to stabilise while TVL either stops declining or begins to recover. Until that shift happens, the current setup points toward slow, reactive price action with downside risk remaining elevated rather than a clear trend reversal.

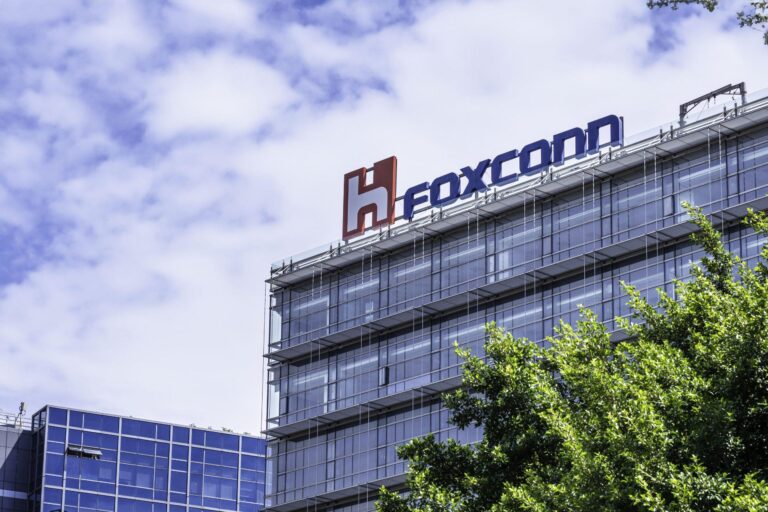
Taiwan’s Foxconn, the world’s largest contract electronics manufacturer, reported a sharp rise in first-quarter revenue.

The strong numbers were supported by surging demand for artificial intelligence infrastructure — even as the company sounded a note of caution over what it described as a “volatile” global political and economic environment.

Revenue for the January-to-March quarter climbed 29.7% year-on-year to T$2.13 trillion (approximately $66.60 billion), Foxconn said in a statement released on Sunday.

The figure came in marginally below the T$2.148 trillion LSEG SmartEstimate.

Foxconn, formally known as Hon Hai Precision Industry, serves as the primary server manufacturer for chipmaker Nvidia and is Apple’s largest iPhone assembler.

Both business lines contributed to the quarterly performance.

The company’s cloud and networking products division was a key growth engine, driven by robust demand for AI-related infrastructure.

Meanwhile, the smart consumer electronics segment — which encompasses iPhone assembly — recorded what the company characterised as “significant” growth, attributed to new product launches during the period.

Inside the numbers

March proved to be a standout month within the quarter.

Revenue for the month alone surged 45.6% on a year-on-year basis to T$803.7 billion, marking a record for that calendar month, according to the company.

Looking ahead, Foxconn expressed confidence in continued momentum.

Operations are expected to grow both quarter-on-quarter and year-on-year in the second quarter, with AI server rack deployments maintaining what the company described as a “continued growth trend.”

Geopolitical risks on the radar

Despite the upbeat near-term guidance, the company introduced a note of caution.

“It remains necessary to monitor the impact of the volatile global political and economic situation,” Foxconn said in its statement, without providing further elaboration.

The warning echoes remarks made last month by Chairman Young Liu, who identified the global economic and political landscape — with particular reference to the conflict in the Middle East — as the company’s most significant external challenge for the year.

Foxconn does not issue numerical financial forecasts. The company is scheduled to report its full first-quarter earnings on May 14.

The revenue announcement comes against the backdrop of a difficult year for Foxconn’s stock.

Shares have declined approximately 16% year-to-date, underperforming the broader Taiwan market benchmark index, which has gained around 12% over the same period.

The stock closed down 2% on Thursday, broadly in line with the benchmark index, ahead of the revenue data release.

Taiwan’s financial markets were closed on Friday for a public holiday and are scheduled to resume trading on Tuesday.

The post Foxconn Q1 revenue jumps 29.7% on AI demand appeared first on Invezz

The post LOL Token Price Explodes 800% as Memecoin Frenzy Masks Risks appeared first on Coinpedia Fintech News

LOL token price just did what memecoins do best which is steal the spotlight when no one’s looking. In the past 24 hours, it quietly climbed to the top of the most-visited charts, overtaking even the usual heavyweights like Bitcoin on Coinmarketcap especially. Not bad for a project sitting at a $9.56 million market cap and trading around $0.009642.

Pull up the LOL/USDT chart and it’s obvious why traders suddenly care. Between March 23 and April 1, the token ripped from $0.001401 to $0.012774 thats an almost 800% surge. That’s not a rally, that’s a vertical sprint.

Since then, things have cooled… slightly. The price has slipped back to around $0.009582, but it’s still up roughly 580% from its starting point. And here’s the weird part it’s not collapsing like most low-cap memecoins after a move like that.

Instead, it’s printing wicks near the top. That usually means one thing: indecision. Buyers want higher, but sellers aren’t done yet.

Whale activity and hype fuel momentum

So what’s keeping it alive? A mix of speculation, hype, and just enough narrative to keep traders interested.

A memecoin whale recently scooped up $8.01K worth of LOL around a $9.44 million valuation. Not massive, but enough to get attention in a low-liquidity environment.

Then there’s the chatter. Discussions around potential funding deals, future growth plans, and even possible major exchange listings are floating around. Add in the usual “biggest meme” claims and you’ve got the perfect cocktail for retail curiosity.

And yeah, it’s working. That’s why LOL token price is sitting at the top of the most-visited rankings despite being ranked deep in the market.

Bubble map reveals underlying supply concentration risks

Now here’s where the story shifts. On-chain data isn’t nearly as fun as price charts but it’s a lot more honest. Bubble map analysis shows something less comforting: clustered supply.

Instead of a wide, decentralized spread of holders, there are visible interconnected groups of wallets especially yellow, pink, teal clusters that suggest coordinated ownership. These aren’t random retail wallets. They’re linked. And that’s a problem.

Because when large chunks of supply sit in connected hands, it creates the perfect setup for a coordinated exit. One move, multiple wallets, and suddenly liquidity disappears. Retail? Usually left holding the bag.

Momentum holds, but structure remains fragile

So, what’s next? Honestly, odds suggests at this point is that it’s a coin flip just like most memecoins at this stage.

If hype keeps building and demand flows in, LOL token price could push higher. That’s how these things work. Momentum feeds momentum.

But let’s be real, practical and mature because underneath the hype, the structure isn’t exactly bulletproof. Supply concentration, speculative demand, and thin liquidity don’t make a stable foundation. For now, LOL token price is riding the wave. The question is how long before the wave turns.

The post BNB Price Rebounds From Key Support—But Bearish Pressure Still Lingers appeared first on Coinpedia Fintech News

BNB price has lost a key structural level at $600, triggering a shift in momentum as bearish pressure begins to take control. The breakdown raised expectations of a deeper correction, but the price is now stabilizing near a critical demand zone around $560–$580. While buyers are attempting to defend this base, the broader structure remains weak, with BNB still trading below key resistance levels. 

The current setup is not a confirmed recovery but a reaction within a weakening trend, where any rebound must reclaim higher levels to invalidate further downside risk.

In the broader perspective, the BNB price appears to have reached the crucial support of the expanding channel. In the times when a rebound is expected, a small pullback below $530 is expected as the indicators hint towards more downside action. This creates a critical setup where the market is no longer trending but deciding whether the current move is a continuation of weakness or the start of a recovery.

Price is consolidating near a strong support band, suggesting buyers are attempting to absorb selling pressure. However, momentum indicators remain weak, with MACD in a bearish crossover and RSI near lower levels, indicating limited buying strength. This keeps the structure fragile, where any rebound must reclaim higher levels to shift momentum back in favor of the bulls.

BNB is approaching a critical support region, with price likely to test the lower demand zone around $520–$525, while an extended dip toward $500 in the worst case. If bulls fail to defend the $500 level, the structure would weaken significantly, opening the door for a deeper correction. On the upside, a successful rebound could push the BNB price back toward $600, followed by a move toward $650, where stronger resistance is likely to emerge.

WASHINGTON — House and Senate Republican leaders jointly announced a plan Wednesday that they said would end the shutdown of the Department of Homeland Security that caused major airport delays.

“In the coming days, Republicans in the Senate and House will be following through on the President’s directive by fully funding the entire Department of Homeland Security on two parallel tracks: through the appropriations process and through the reconciliation process,” House Speaker Mike Johnson, R-La., and Senate Majority Leader John Thune, R-S.D., said in a statement.

The two leaders were vague about the exact plan, but it appears to closely resemble the Senate’s preferred path from Friday.

Johnson and Thune heavily implied that it would be for the Senate to, once again, pass a bill it approved unanimously last week, which it could try to do as early as Thursday.

It would fund all of DHS except ICE and Customs and Border Protection, which Democrats won’t agree to fund without reforms to immigration enforcement operations. Those two agencies already have separate funding.

House Republican leaders trashed that bill and rejected it Friday, but they now appear ready to back down and accept the Senate plan. They would have to vote to pass it through the House.

GOP leadership had no immediate comment on the timing for a vote. Both chambers are scheduled to be on recess until April 13.

Then Republicans would fund ICE and CBP in a separate party-line “budget reconciliation” bill that could bypass a filibuster and get approved without any Democratic votes. The timing for that is even less clear.

Johnson and Thune said the “two-track” plan would “fully reopen the Department, make sure all federal workers are paid, and specifically fund immigration enforcement and border security for the next three years so that those law-enforcement activities can continue uninhibited.”

A White House official told NBC News that the administration supports the Johnson-Thune plan.

Earlier Wednesday, President Donald Trump called on Republicans to pass the party-line bill “no later than June 1st.” He threw the earlier plans to reopen DHS into chaos last week when he declined to comment on the Senate bill, which led House Republicans to reject it.

DHS has been shut down for more than a month, with employees for the TSA, FEMA and other agencies going for weeks without pay. Trump signed an executive order last week to pay TSA employees, but the legality and length of that plan are murky. Thousands of civilian Coast Guard employees and other DHS workers are still not being paid.

Senate Minority Leader Chuck Schumer, D-N.Y., slammed Republicans for having “derailed a bipartisan agreement” for days, “making American families pay the price for their dysfunction.”

“Throughout this fight, Senate Democrats never wavered. We were clear from the start: fund critical security, protect Americans, and no blank check for reckless ICE and Border Patrol enforcement,” he said Wednesday. “We were united, held the line, and refused to let Republican chaos win.”

On Friday, House Minority Leader Hakeem Jeffries, D-N.Y., said, “House Democrats are prepared to support the bill to end the Trump-Republican shutdown of the Department of Homeland Security, make sure TSA agents are paid, stand up for FEMA and for the Coast Guard, for our cyber security professionals, and stop inconveniencing Americans.”

Delta Air Lines stock price has done better than other American airlines during the ongoing Iran war. It has jumped by 5% in the last 30 days, while other companies like Southwest, United Airlines, and American Airlines have dropped by over 10% in this period. 

DAL stock vs other top airlines | Source: TradingView

Delta Air Lines to publish earnings on April 8

The DAL stock price has done better than other airline companies during the ongoing Iran war that has pushed jet fuel prices higher. Data compiled by IATA shows that the average jet fuel price jumped to $195 a barrel, up by 103% from a month earlier.

Historically, many American airlines helped to deal with these price swings through hedging, a move that most of them ended recently. Delta does not hedge these fuel costs, meaning that it is now having to pay the full price, a move that will undoubtedly affect its margins.

The company will provide more information on how the war will impact its business this year. On the positive side, the company has navigated such shocks before, including in 2022 when Russia invaded Ukraine, leading to higher crude oil prices and flight disruptions.

Also, there is a possibility that jet fuel prices will crash once the war ends, which may happen in the coming weeks or months. Donald Trump has set a deadline for about 2 weeks although analysts believes that it will last for longer.

The most recent results showed that Delta’s business did well in the fourth quarter and last year despite the challenges in the civil aviation industry. Its fourth quarter revenue rose to $16 billion, while the operating profit jumped to $1.5 billion. The company made an operating cash flow of $2.3 billion.

For the year, Delta made over $63.4 billion in revenue, $5.8 billion in operating profit, and an operating cash flow of $14.1 billion. Its total debt and lease obligations ended the year at $14.1 billion.

The company’s business has done well because of its strong market share in key routes in the US and the emphasis on premium seats. It is also cutting the debt it accumulated during the pandemic.

Analysts expect the upcoming results to show that its revenue rose by 5.38% in the first quarter to $14.8 billion, while the earnings-per-share (EPS) rose from 46 cents to 62 cents. 

Chances are that the real numbers will be lower than these estimates because of the war and soaring fuel prices. The annual revenue is expected to grow to $67.2 billion this year followed by $70 billion next year.

DAL stock price technical analysis 

Delta Air Lines stock chart | Source: TradingView 

The daily chart shows that the DAL stock price has done well in the past few weeks, moving from a low of $55.20 in March to the current $66.7.

The stock has formed a harami candlestick pattern, which is made up of a small bullish candle that follows a bigger bearish one.

Delta Air Lines stock remains above the 50-day and 100-day Exponential Moving Averages (EMA) and the ascending trendline that links the lowest swings since June last year  

Therefore, the most likely scenario is where the stock continues rising, possibly to the year-to-date high of $76, which is up by 14% above the current level.

The post Delta Air Lines stock price analysis and earnings preview: buy or sell? appeared first on Invezz

The post Solana Hasn’t Bottomed Yet—Here’s Where the Real SOL Rally Could Begin appeared first on Coinpedia Fintech News

The Solana price faced significant upward pressure as the broader market sentiments turned bearish following Trump’s address on the ongoing war. After losing a key support zone, the SOL is now trapped below the resistance, which may resemble a distribution, not a recovery. However, the buyers have not stepped in with conviction, while the price has not reclaimed any critical levels. As long as the SOL price does not reclaim its lost structure, the downside risk continues to prevail. 

Hence, now the question arises whether the current correction is another consolidation or an accumulation. 

Solana has lost a major horizontal support zone around $110–$120, a level that previously acted as a strong demand base throughout multiple cycles. Currently, the same level has flipped into resistance, where a retest may turn into selling opportunities hereafter. Historically, these types of structures tend to resolve lower. 

The broader structure shows lower highs forming consistently after failure to reclaim key resistance between $110 and $120. Moreover, the recovery was extremely low after a sharp decline due to a weak bounce. Moreover, it is compressing just above a major downside target, highlighting a critical support level at $50. 

This is the level where previous consolidation occurred with a strong demand, where risk-reward becomes attractive again. Therefore, the trade set suggests the SOL price may continue to remain range-bound and further initiate a breakdown to the demand zone. 

Collectively, Solana is trading below broken structure and remains a wait-for-confirmation market, not a bottoming market. Failure to reclaim $100 to $110 keeps the pressure intact, while a breakdown below the range opens a move toward $60 first, then $50, which is the key accumulation zone. Until then, every bounce is likely a lower high in formation, not the start of a new rally. 

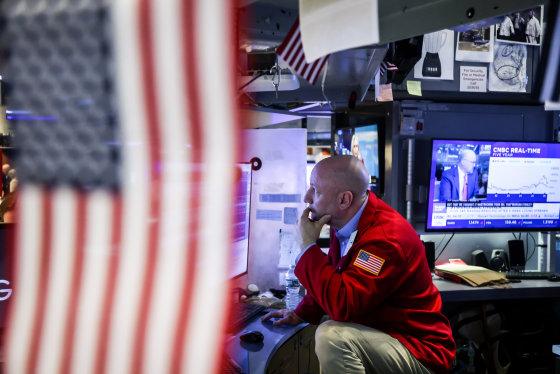
Stocks surged Tuesday, with the S&P 500 closing up 2.9% while the Nasdaq rose 3.8% and the Dow gained 1,125 points.

But this very good day capped off what was a very bad month for U.S. equities. The S&P 500 fell 5.09% in March, and the Nasdaq Composite declined 4.75%.

The U.S.-Israeli war on Iran and the near-total blockade of the Strait of Hormuz, a narrow, Iranian controlled waterway through which a fifth of the world’s crude oil typically transits every day, weighed heavily on markets throughout the month.

Tuesday was also the end of the first quarter of the year, one when the S&P 500 and Nasdaq posted their worst annual starts since 2022, when the Russian invasion of Ukraine rocked markets.

For the first quarter, the S&P 500 dropped 4.6% and the Nasdaq declined 7.1%.

Oil prices, meanwhile, soared over the past month, driving up the cost of fuel and triggering a domino effect of higher prices around the globe.

Brent, the international oil benchmark, posted its largest monthly percentage increase ever, after having risen more than 60%. The price of U.S. West Texas Intermediate crude oil also soared in March, climbing more than 50% in its biggest one-month gain since 2020.

For millions of drivers in the U.S., the increases manifest as higher prices for gas. And here, too, the past month was remarkable. The average price of unleaded gasoline hit $4 per gallon Tuesday, up more than 34% in just four weeks.

But it’s not just gas prices that hit U.S. households this month.

More than half of all adults in the U.S. own stocks, often via their retirement accounts and the broader funds those managed accounts invest in. Most of the time, market moves up and down don’t swing the value of those kinds of diversified retirement accounts.

But March was a different story.

“Stocks have been following the lead of oil prices at an unprecedented rate over the last several weeks, and if the U.S. just walked away from the Middle East with the Strait still blockaded, energy markets would likely remain incredibly supply-constrained, keeping prices high,” analysts at Bespoke Investment Group wrote Tuesday.

“The longer prices are high and supplies are limited, the worse it’s going to be for the global economy and ultimately stock prices,” they added.

The wild market swings of the second Trump administration are in sharp contrast to how Donald Trump said the markets would react if he were elected to a second term in 2024.

“There are many people that are saying that the only reason the Stock Market is high is because I am leading in all of the Polls, and if I don’t win, we will have a CRASH of similar proportions to 1929,” Trump wrote on Truth Social in May 2024 as he campaigned for the presidency.

Shortly after he was re-elected in 2024, Trump was asked whether he believed market indexes were good barometers of his performance in office. “To me … all of it together, it’s very important,” he told CNBC.

But during the first 14 months of his second term, U.S. markets have faced some of the sharpest drawdowns in history.

In February and March of last year, Trump’s sweeping tariff policies roiled the market, pushing the S&P 500 into its seventh-fastest correction of all time. A correction is when a stock or an index declines 10% from its most recent record high.

Just over a year later, the S&P 500 isn’t far from doing it again. As of Tuesday’s closing bell, the index had tumbled 6.7% from its most recent high in January.

As oil prices rise, stocks typically fall given that higher oil prices typically lead to higher prices across a number of industry sectors over the long run.

Already, inflation is on the rise around the world. On Tuesday morning, eurozone inflation came in at 2.5%, from 1.9% the month before, according to the European Central Bank.

On Tuesday, the Nikkei 225 in Japan recorded its worst month since 2008. In Europe, the Stoxx 600 index posted its worst month since 2022.

Two near-corrections in just over a year illustrates just how volatile the administration’s policies have been for markets.

Still, since Trump took office for a second time, the S&P 500 is up 8%, although last year global stocks far outpaced the broad U.S. index.

In 2025, global stocks as measured by the MSCI ACWI ex USA index rose nearly 30%, while U.S. stocks rose just 16%. Global stocks haven’t beaten American equities by that much during the first year of a presidential term since 1993, according to data from Bloomberg.

In recent weeks, Trump has repeatedly touted the Dow’s recent 50,000 milestone as a sign that the markets are doing well in his presidency.

“You know, it’s sort of crazy, I hit 50,000 on the Dow,” Trump said at an investment conference in Florida on Friday. “People said that wouldn’t be possible within four years.”

“And then we hit 7,000 on the S&P,” Trump added. “People said that’s even harder than hitting 50,000 on the Dow.”

As of Tuesday, the Dow had plunged more than 3,600 points since it hit 50,000, a drop of nearly 7.5%.

Investors are running into Intuitive Machines (NASDAQ: LUNR) following its historic launch of “Artemis II” – which successfully sent four astronauts on a lunar flyby on Apr. 1.

The Artemis news came only days after “NASA” selected LUNR for its commercial lunar payload services (CLPS) task order, further adding technical validation to the firm’s infrastructure.

However, with rumours of billionaire Elon Musk’s aerospace company SpaceX going public – it’s reasonable to question whether it’s as far as Intuitive Machines stock goes in 2026.

After all, a SpaceX debut could act as a capital vacuum, potentially draining liquidity from smaller aerospace players as institutional portfolios pivot toward the industry titan.

LUNR stock is well-positioned for SpaceX IPO

For those invested in LUNR shares, here’s the good news – the impact of a SpaceX IPO may be exactly the opposite on Intuitive Machines.

While it seems logical that a giant like SpaceX would “cannibalize” investment, the market is already treating its reported confidential filing as a “rising tide that lifts all boats.”

Instead of stealing capital from Intuitive Machines, the SpaceX news is proving a major “tailwind” that helped LUNR hit a new year-to-date high on Thursday morning.

Why? Simply because of sector re-rating. Note that SpaceX is reportedly targeting a $1.75 trillion valuation; Wall Street is being forced to change how they value smaller players.

Simply put, if the industry leader is worth trillions, market participants must start looking at smaller firms like Intuitive Machines and realize that they might just be significantly undervalued in 2026.

In a way, the SpaceX IPO legitimizes the entire space economy for institutional investors who may have previously stayed on the sidelines.

How to play Intuitive Machines shares at current levels?

Intuitive Machines shares are insulated from the potential cannibalizing effect of a SpaceX listing also because the firm’s business complements, not competes with the Elon Musk company.

These two businesses actually occupy different layers of the space stack.

SpaceX is the railroad – the infrastructure and the launch vehicle, while LUNR is the “last mile” –  specializing in lunar landing, lunar data networks, and surface operations; niche services that SpaceX often partners with rather than replaces.

What’s also worth mentioning is that a SpaceX IPO, while massive, is broadly expected to be super exclusive.

Reports suggest that only 30% of it will go to retail, with the bulk snapped up by sizable sovereign wealth funds and “mega-cap” institutions.

For an average investor or a mid-sized fund, therefore, LUNR remains the most accessible “pure-play” for direct exposure to the NASA missions and the lunar economy.

This is why Wall Street remains bullish on Intuitive Machines Inc for the remainder of 2026. The consensus rating on LUNR shares sits at “moderate buy” currently, with the mean price objective of about $26 indicating potential upside of another 8% from here.

The post LUNR stock hits YTD high: could SpaceX cannibalize the stock appeared first on Invezz